Approximately 7.3 million students with disabilities are educated in U.S. public K-12 schools, a number that has been growing over the past few decades. Students with disabilities, ages 3 to 21, are educated under the federal Individuals with Disabilities Education Act (IDEA), which guarantees them the right to a free public education and appropriate special education services.
In honor of Disability Pride Month, here are some key facts about public school students with disabilities, based on the most recent data from the National Center for Education Statistics (NCES).
July marks both Disability Pride Month and the anniversary of the passage of the Americans with Disabilities Act. To mark these occasions, Pew Research Center used federal education data from the National Center for Education Statistics to learn more about students receiving special education services in U.S. public schools.
For the purposes of this analysis, students with disabilities include students ages 3 to 21 who are covered by the federal Individuals with Disabilities Education Act (IDEA), which guarantees that children with disabilities will receive a “free appropriate public education,” including special education and related services.
The 7.3 million students with disabilities in the United States made up 15% of the nation’s public school enrollment in the 2021-22 school year. The number and percentage of kindergarten through 12th grade students covered by IDEA has increased over the past few decades. For example, in the 2010-11 school year, there were 6.4 million students with disabilities in U.S. public schools, making up 13% of enrollment.
The number of students receiving special education services temporarily declined during the coronavirus pandemic, the first decline in a decade. Between the 2019-20 and 2020-21 school years, the number of students receiving special education services fell 1%, from 7.3 million to 7.2 million. This marks the first year-over-year decline in special education enrollment since 2011-12.
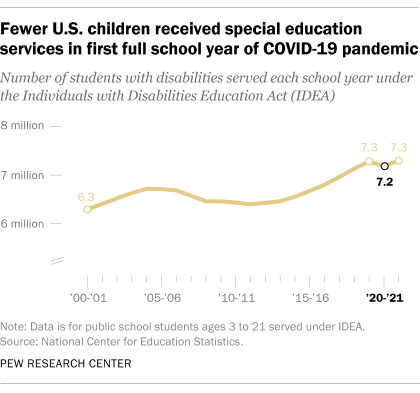
The decline in the number of students receiving special education services contributed to a 3% decline in total public school enrollment from 2019-20 to 2020-21. Special education enrollment returned to pre-pandemic levels in 2021-22, while overall public school enrollment remained steady.
These enrollment trends may reflect some of the learning challenges and health concerns faced by students with disabilities and their families during the COVID-19 pandemic, when many school districts limited or suspended special education services.
Many school districts are struggling to hire special education professionals. In the 2020-21 school year, 40% of public schools that had special education teacher vacancies reported they had very difficult or were unable to fill the positions.
The only two subject areas where public schools have a similar number of teacher vacancies they are actively hiring for are foreign languages (43%) and physical sciences (37%).
As the COVID-19 pandemic puts a spotlight on the nationwide teacher shortage, special education teacher positions have long been among the toughest for school districts to fill.
The most common disability among students in kindergarten through grade 12 is a “specific learning disability,” such as dyslexia. In 2021-22, about one-third (32%) of students receiving services under IDEA had a specific learning disability. About 19% had a speech or language disorder, and 15% had a chronic or acute health problem that negatively affected their academic performance. Chronic or acute health problems include illnesses such as heart disease, asthma, sickle cell anemia, epilepsy, leukemia, and diabetes.
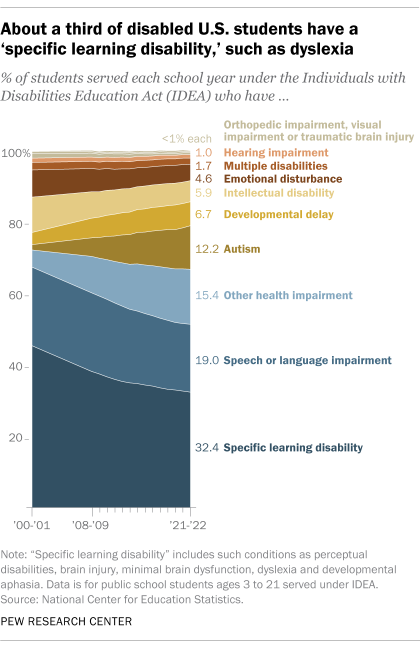
Autistic pupils made up 12% of disabled schoolchildren nationwide in 2021-22, compared with 1.5% in 2000-01. Over the past 20 years, the proportion of disabled pupils with specific learning difficulties, such as dyslexia, has fallen from 45% to 32%.
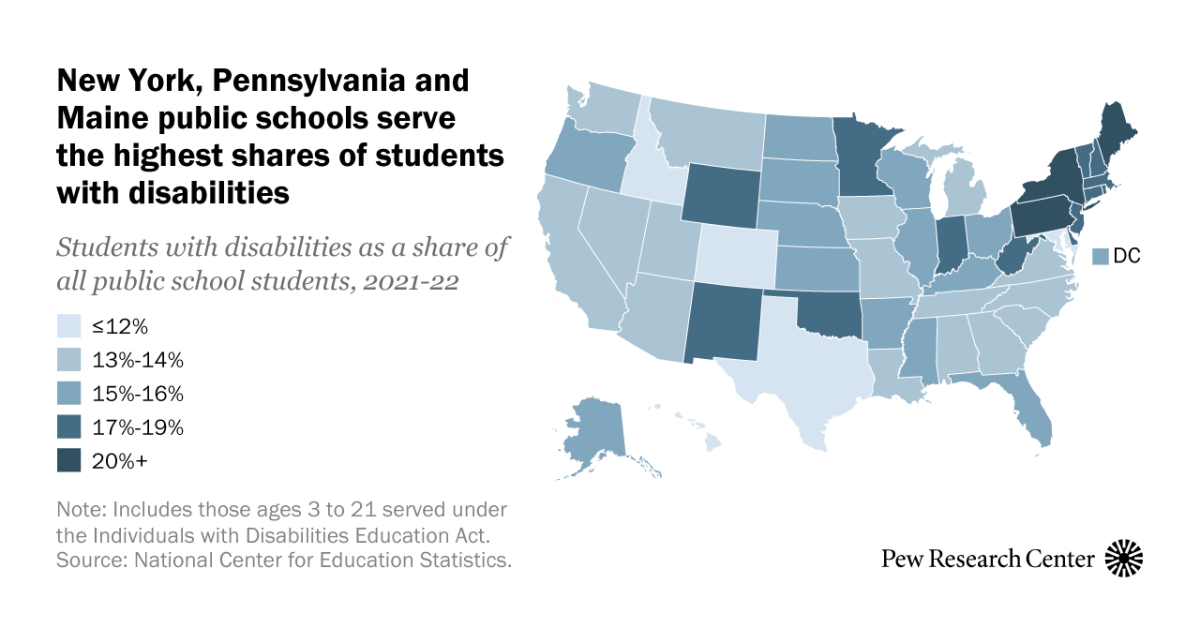
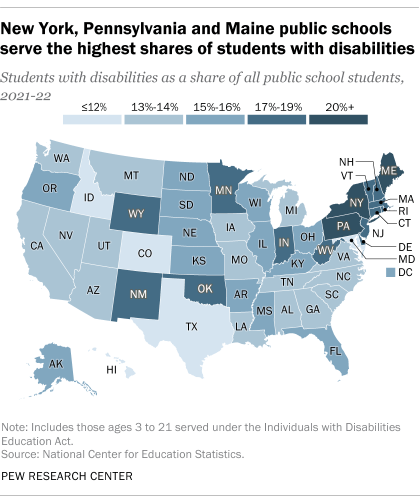
The percentage of students receiving special education services varies widely by state. New York has the highest percentage of students with disabilities in the country, at 20.5% of all public school students. Pennsylvania (20.2%), Maine (20.1%), and Massachusetts (19.3%) have the next highest percentages. States with the lowest percentages of students with disabilities are Texas and Idaho (both at 11.7%), and Hawaii (11.3%).
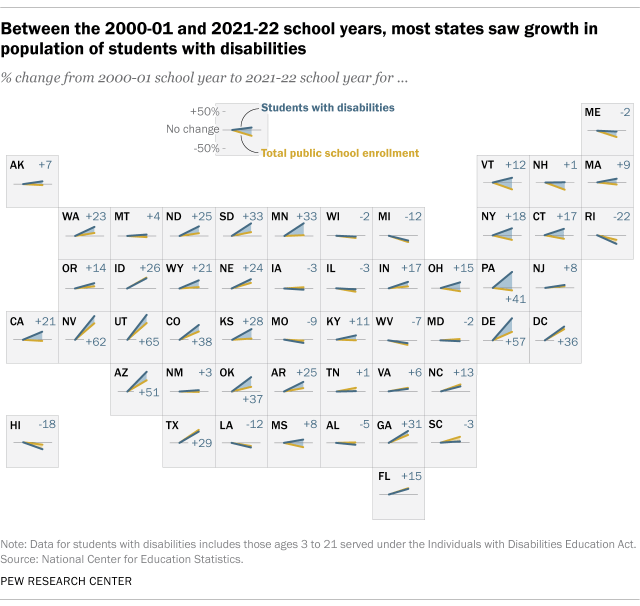
Between the 2000-01 and 2021-22 school years, all but 12 states saw an increase in the number of students with disabilities. The largest increase was in Utah, where the number of students with disabilities increased by 65%. Rhode Island saw the largest decrease, with a 22% decrease.
These state variations are likely the result of inconsistencies in how states determine which students are eligible for special education services and the difficulty of identifying children with disabilities.
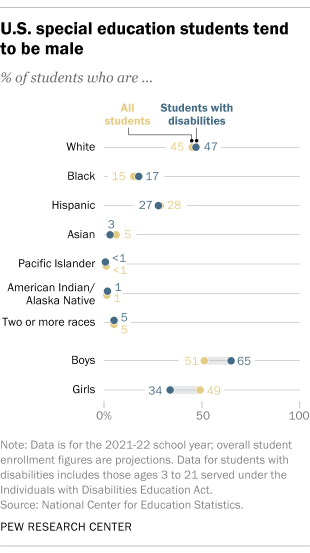
The racial and ethnic composition of special education students nationwide is similar to the overall public school student population, but there are differences by gender. Data for the 2021-22 school year show that roughly two-thirds (65%) of students with disabilities are male and 34% are female. The overall student population is roughly evenly split between boys and girls.
Research has revealed that decisions about whether to recommend a student for special education can be influenced not only by a school’s socioeconomic composition, but also by a school’s test scores and other academic indicators.
Note: This is an update to a post originally published on April 23, 2020.

